Used vehicle inventories hit a new high as prices cool
- Used dealer used inventory at its highest point to date in Cox Automotive’s database
- Used vehicle prices on dealers continue to soften, back to 2021 levels on the Price Index
- Second-hand EV supply up 75% YoY but still less than 1.0% of the market by sales
- Manheim auction sales volume up 65% in July, including all-time Fleet & Lease records
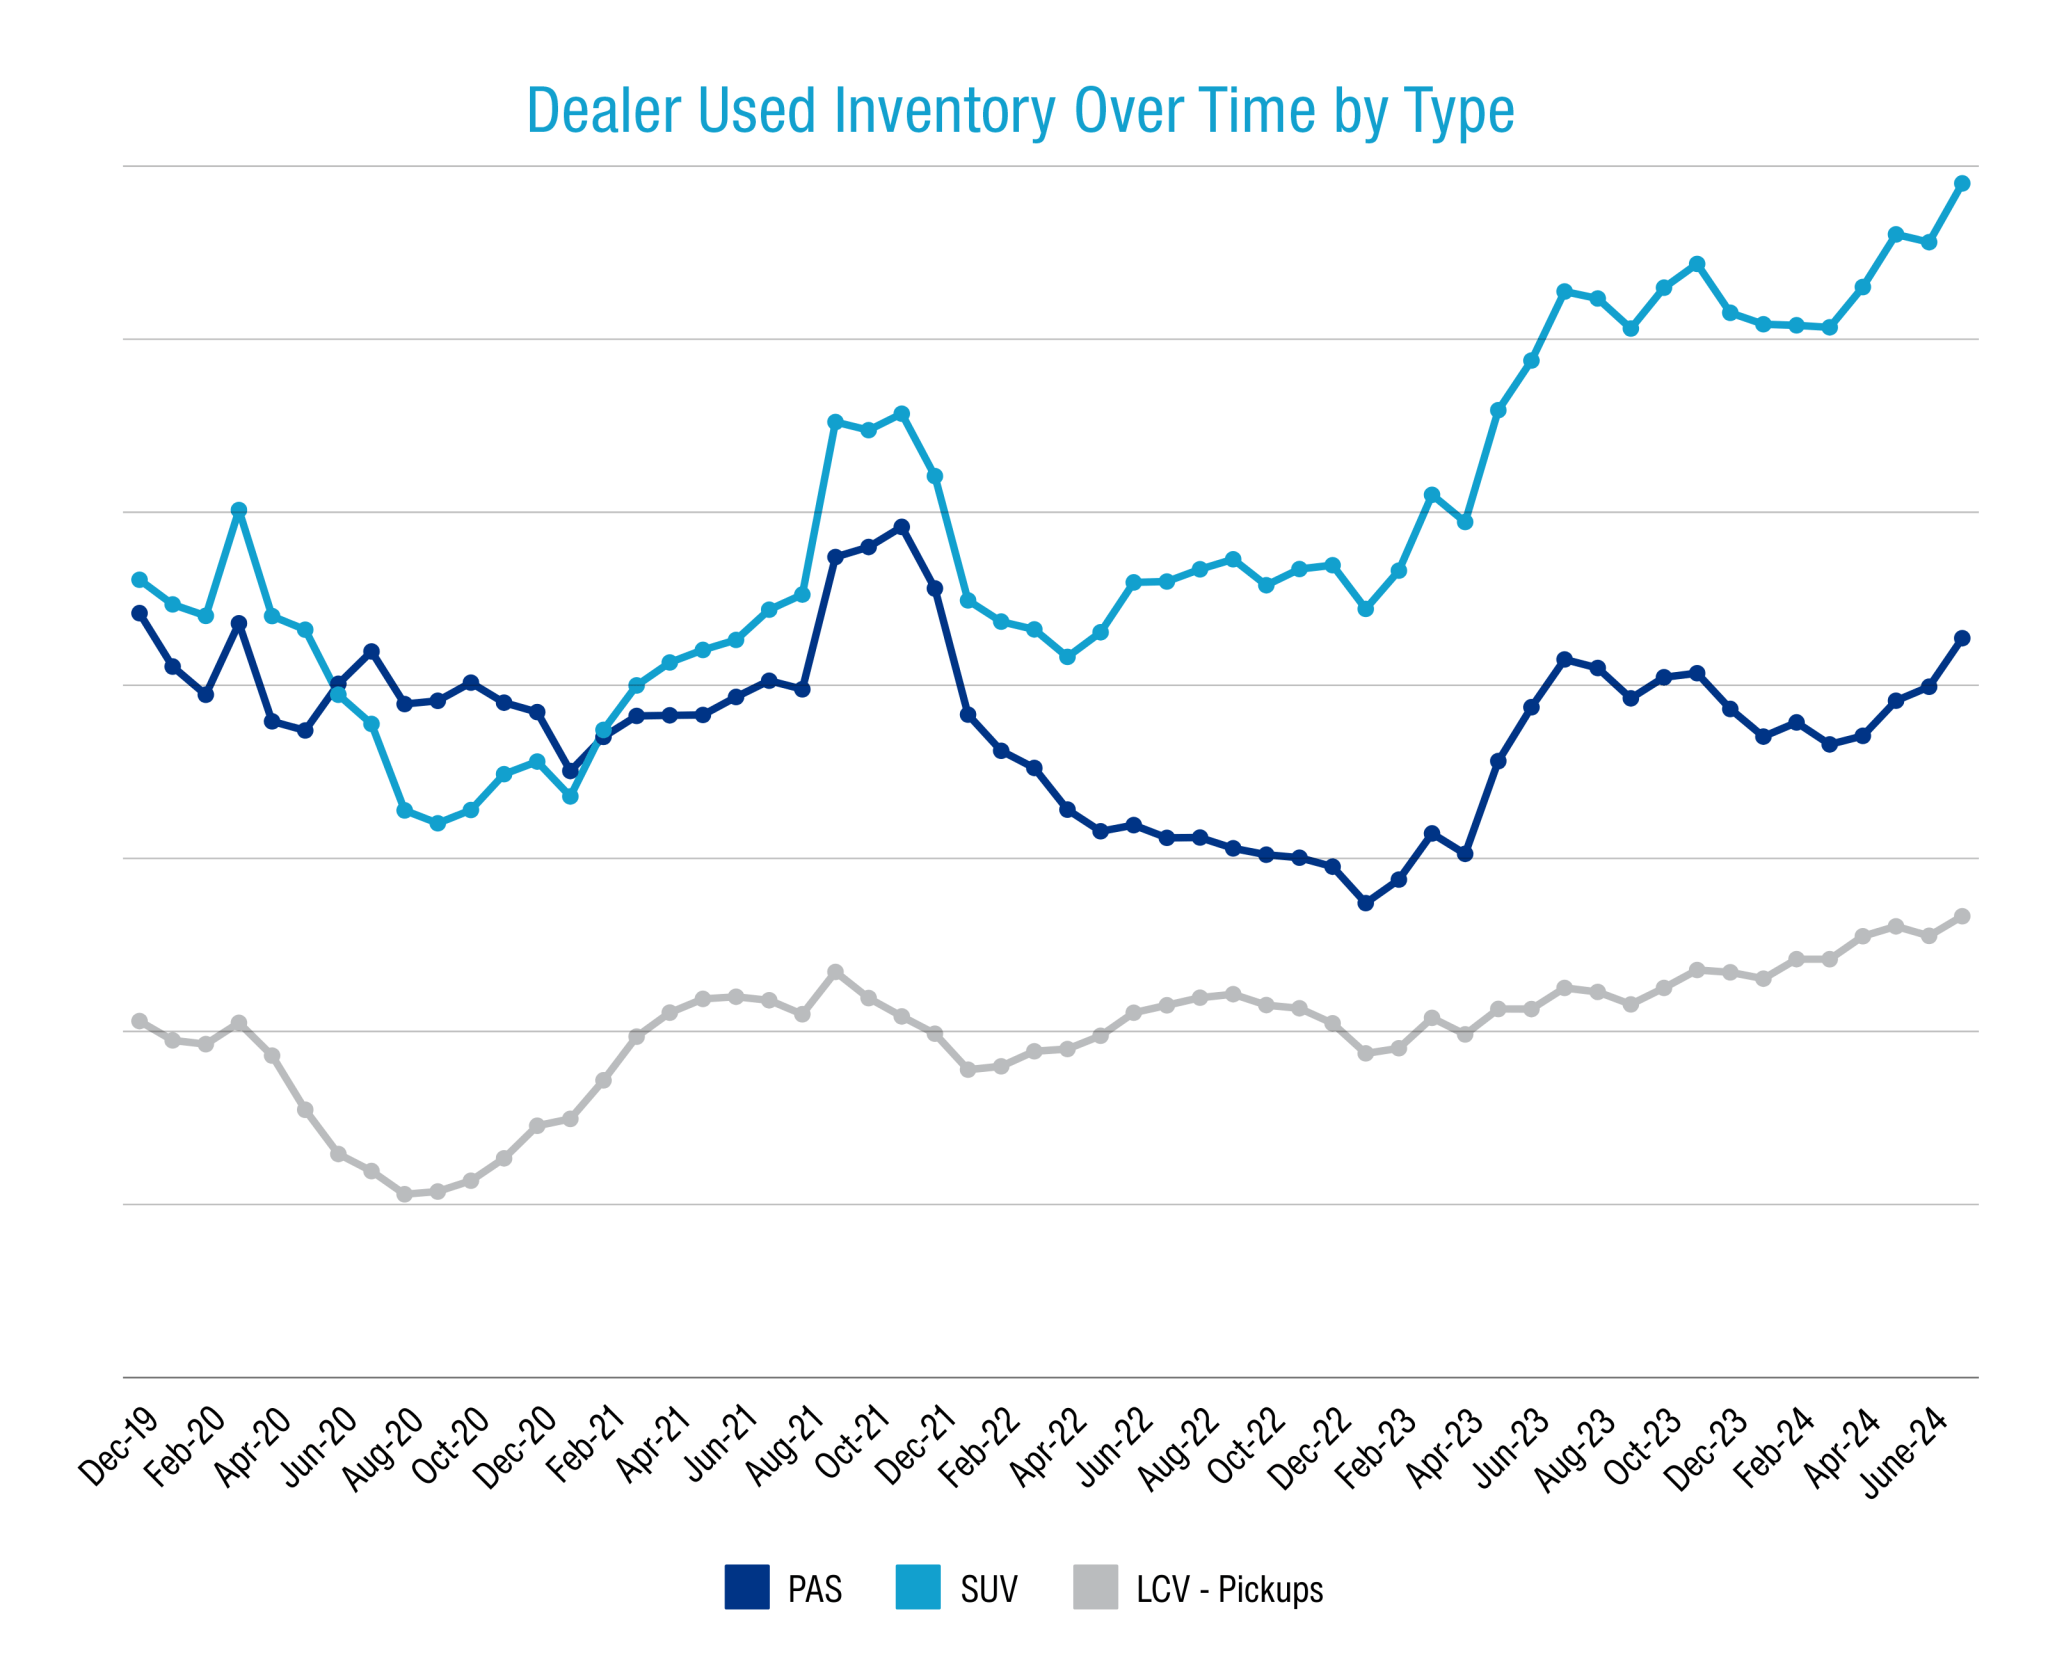
Ongoing high new-car sales have helped push dealer-used vehicle inventories to the highest level on record in Cox Automotive Australia’s (CAA) retail database.
Cox Automotive tracks the retailer used market closely, covering a majority of second-hand cars, SUVs and light commercials listed in Australian dealers at any point in time.
Total inventory captured in CAA’s database increased 5.7% in July 2024 compared to the previous month and is a significant 9.4% greater in size today than it was at this point in 2023.
Increased supply in the dealer-used vehicle market naturally correlates with the record-setting new vehicle market performance in 2024, with the new and second-hand sectors inextricably linked – older cars are usually swapped out for new ones.
The increase in inventory shows that new supply of second-hand cars is outpacing consumer demand despite positive growth there too, with July 2024 sales of dealer-used cars up a more modest 0.8% over June 2024.
Nevertheless, dealer-used vehicle sales in July 2024 still hit their highest point in a month since November 2020, a period of almost four years. Year-to-date dealer-used sales are up 9.4%.
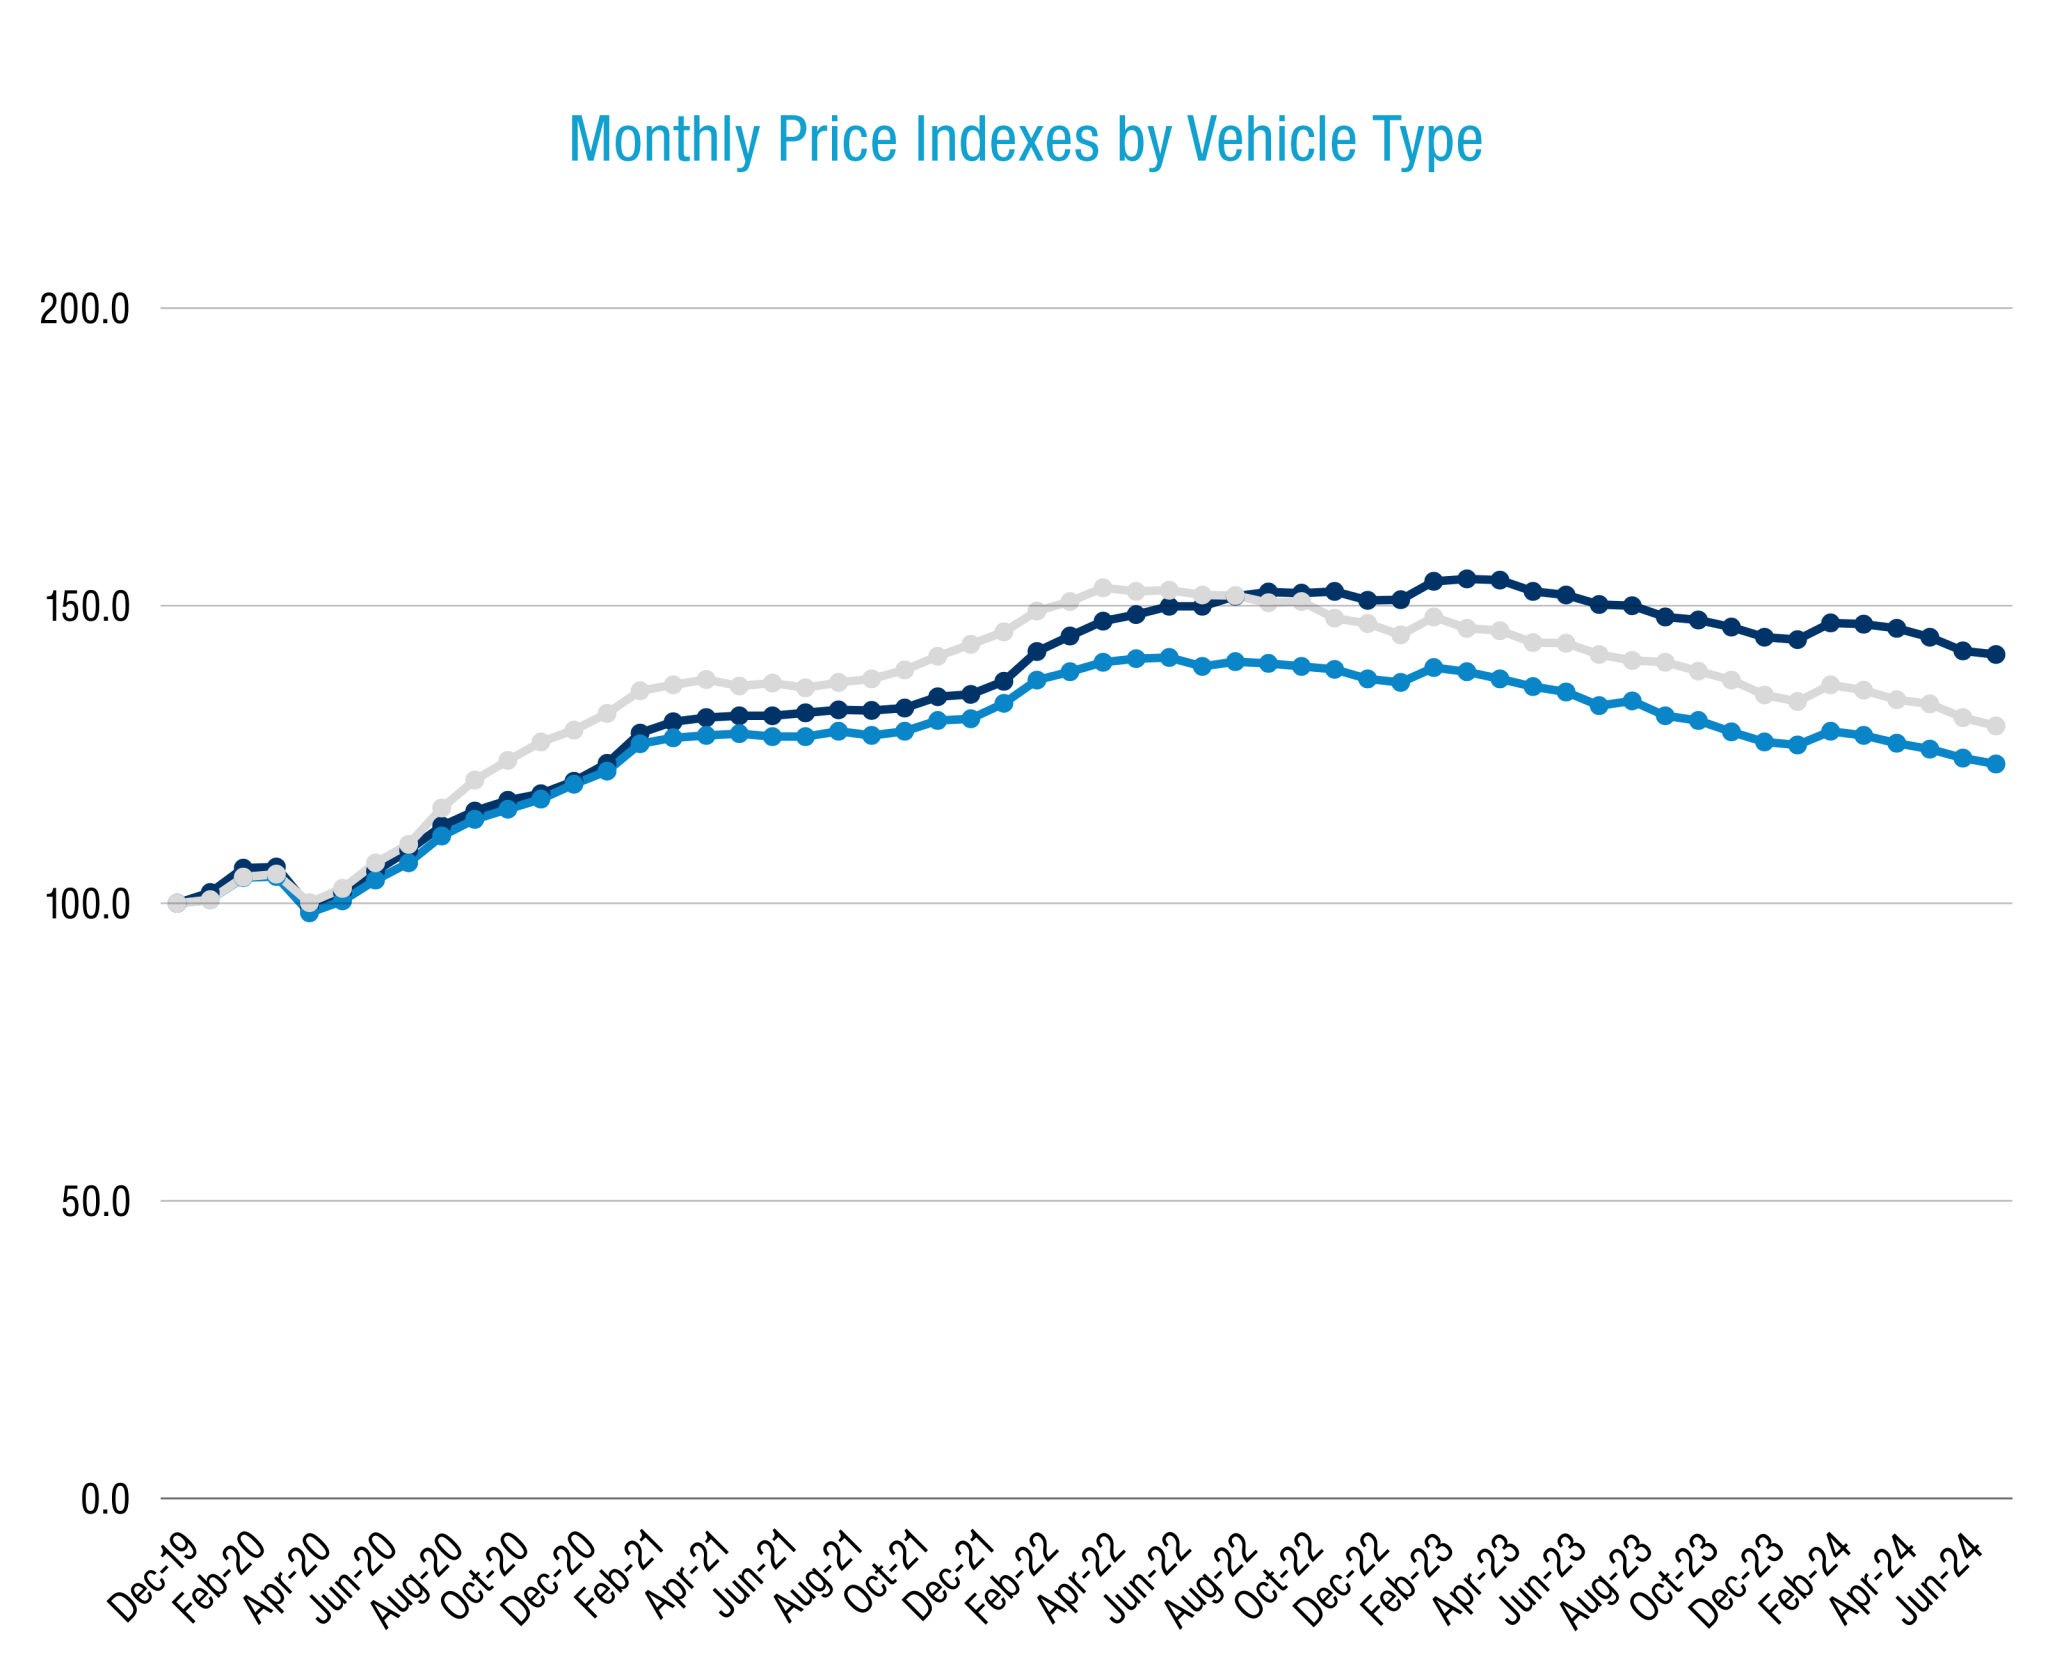
Robust used vehicle supply naturally compresses pricing, and the Cox Automotive Australia used vehicle Price Index declined a further 0.5% in July over June, to 131.2.
A Price Index of 131.2 denotes an average per-vehicle price increase of 31.2% since December 2019 when the index began, adjusted by MSRP and volume-weighted.
The index is now at its lowest point since February 2021, meaning on average used cars today are effectively selling on average for about what they cost three-and-a-half years ago.
But as has become a familiar pattern, price patterns over time vary across the used car fleet depending on age and vehicle type: Older cars remain more inflated than younger ones relative to pre-COVID, and traditional passenger hatches and sedans are more inflated than SUVs.
For example, the CAA price index on 2–4-year-old hatchbacks and sedans is 131.9 whereas the index for the same sorts of vehicles aged 8-10 is 164.3. This doesn’t mean older cars are more expensive, but rather means they are more inflated relative to the end of 2019.
Traditional passenger vehicles are also more inflated than SUVs across the board, with respective average price indexes of 141.8 versus 123.4 – denoting an average 41.8% real price increase versus 23.4%.
Why is this occurring? For one thing older vehicles are inflated because cost-of-living challenges are driving up demand for older and more affordable vehicles, while SUVs of all ages are depreciating more quickly than traditional passenger cars because there is greater supply.
This latter point is reflected in the average Market Days’ Supply of SUVs being 64 and the MDS for passenger cars being 62 days. To put this into more context, inventory of used passenger cars is up 37% in the past two years, while supply of used SUVs is up a more robust 50%.
Strong performing used vehicle retailers sell their vehicles quickly, so it’s important to price them right. CAA data however shows 40.2% of used vehicles are discounted online prior to sale, by an average of 7.3%, the highest rate of discounting since May 2020.
This means four-in-10 used vehicles sit on lots for longer than they need to because the initial asking price is out of step with the market, perhaps more reflective of the sort of premiums we saw in 2022.
In regard to the emerging used electric vehicle market, second-hand EV inventory is up 75% across the past 12 months and 202% over the past 24 months.
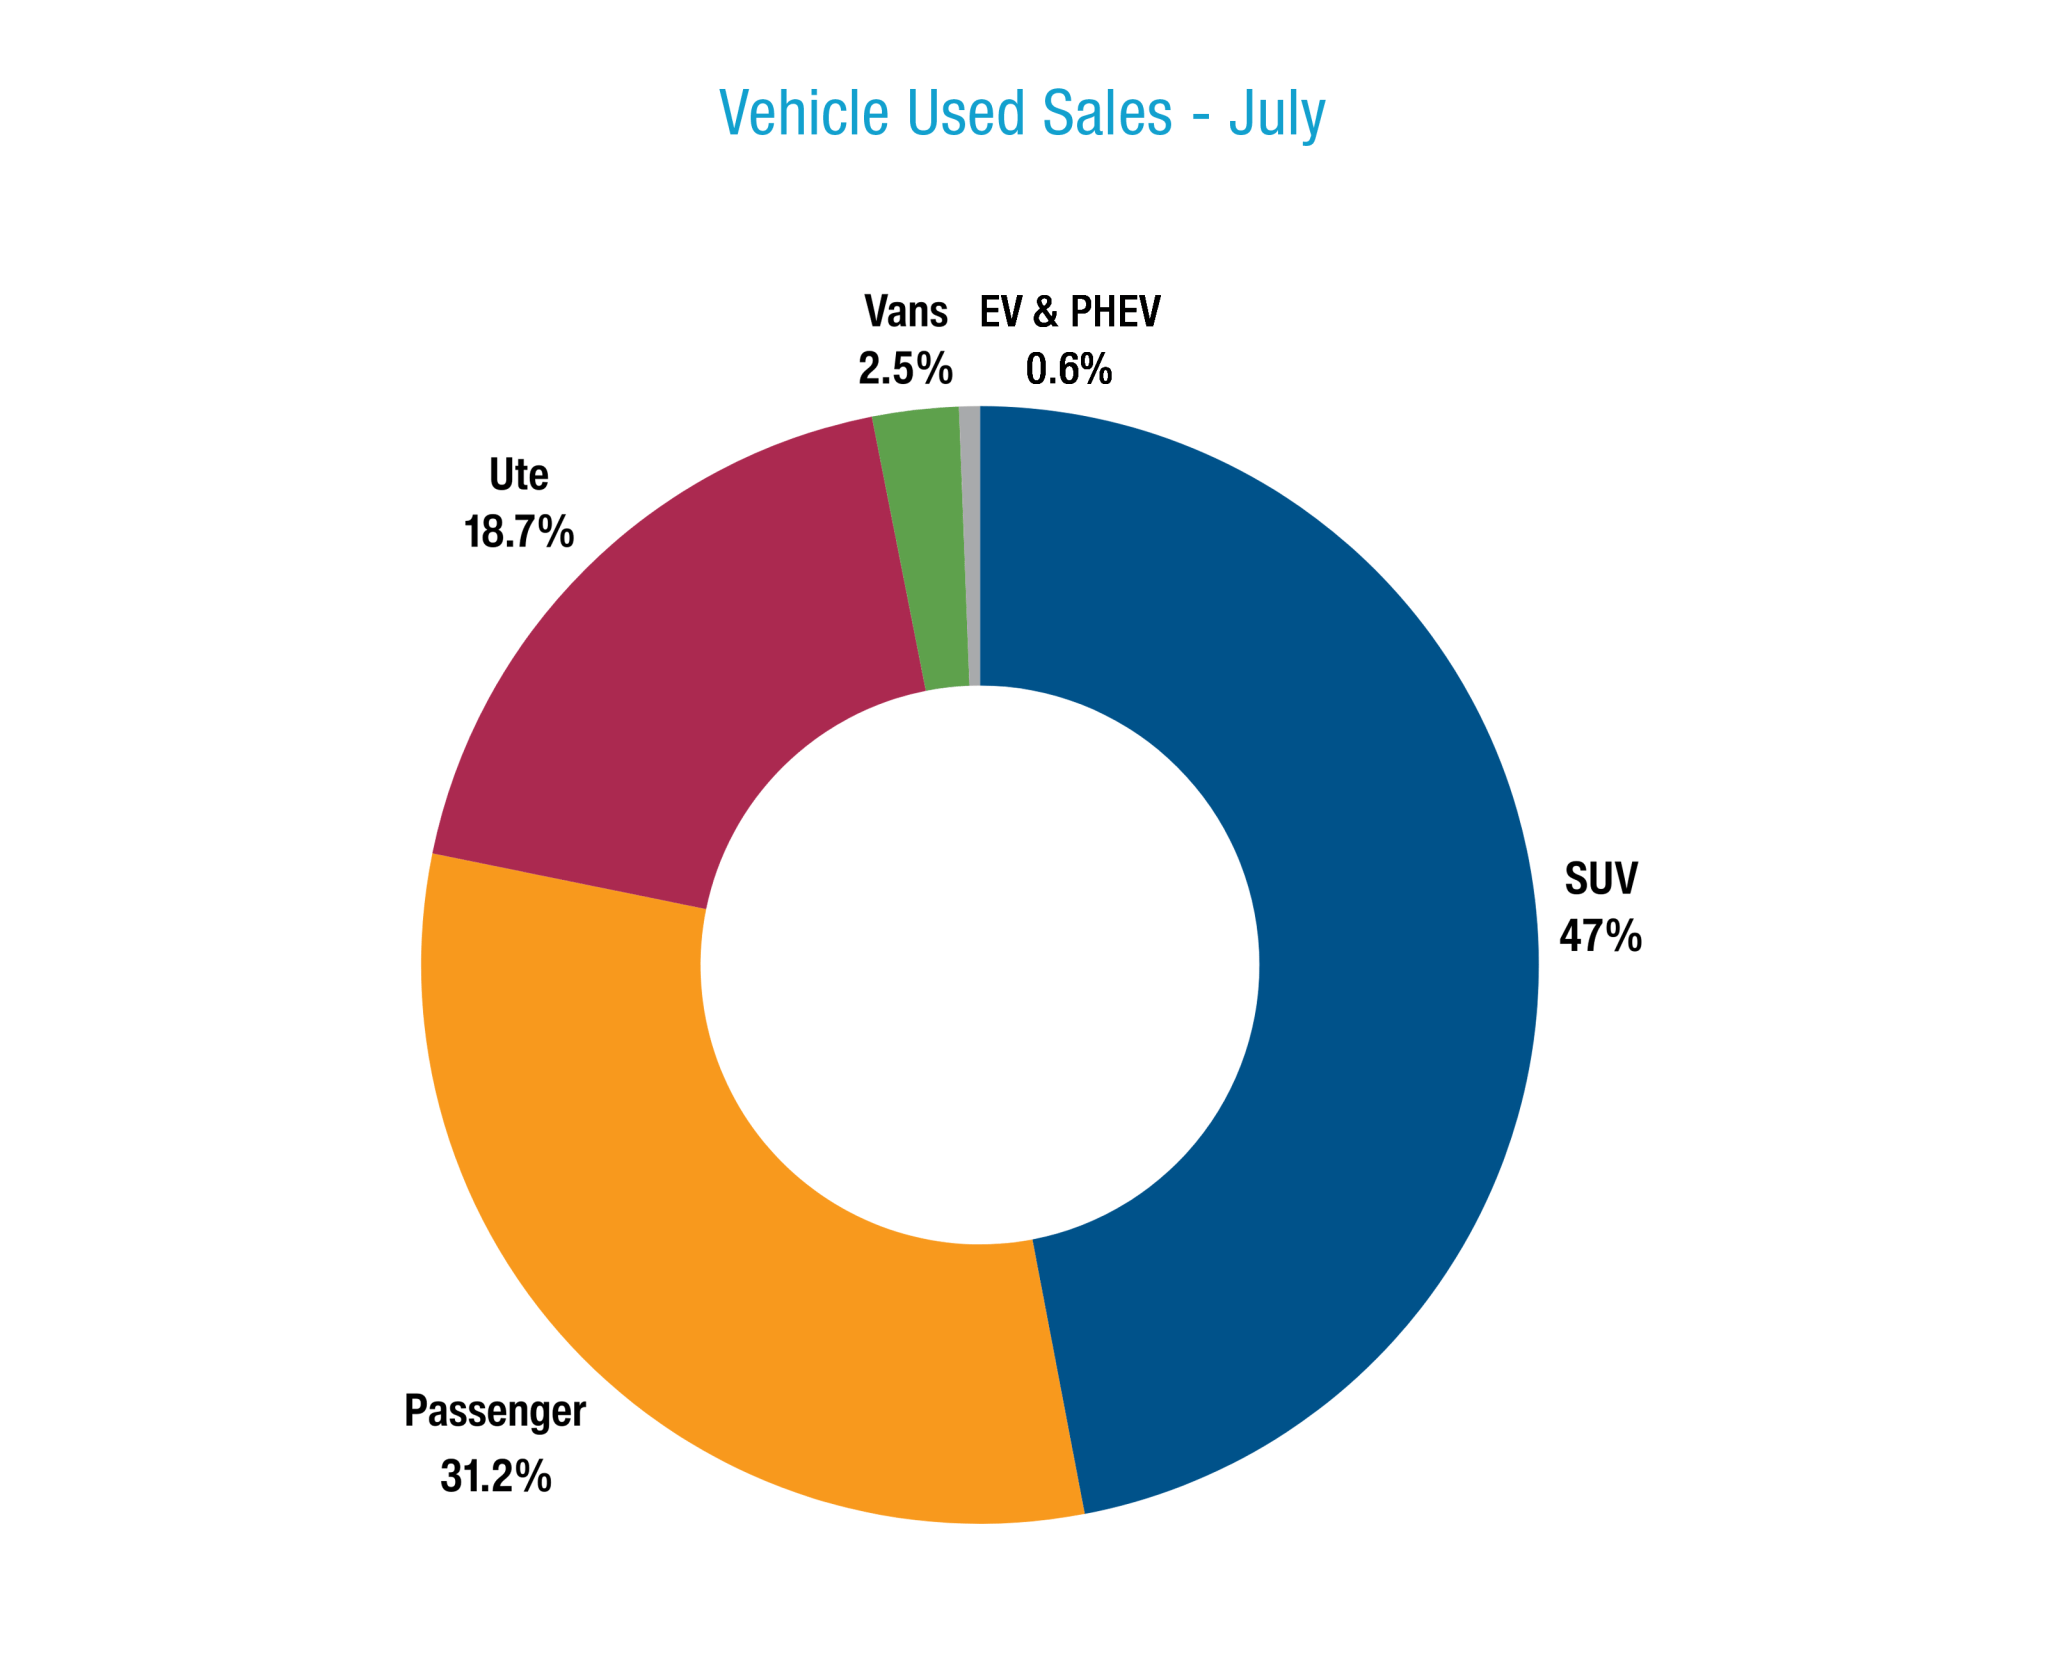
Top 5 selling dealer-used vehicles July 2024
- Ford Ranger: Up 23.3% YoY
- Toyota HiLux: Up 2.9%
- Toyota Corolla: Up 44.5%
- Toyota RAV4: Up 3.7%
- Hyundai i30: Up 4.6%
Manheim wholesale
In the wholesale used market, which Cox Automotive Australia tracks through Manheim auctions, volume is higher today than at any point in the past four years, with July sales up 65% YoY and 17% MoM. YTD Manheim auction volume is up 43.9%, and well ahead of target.
Average auction wholesale prices are at their lowest since July 2020, with the Manheim price index ending July 2024 at 132.1. This is down 21.2% since the wholesale sector peaked in mid-2022, meaning wholesale used vehicles are more accessible today for dealers.
Last month saw Manheim set a new record for Fleet and Lease asset volume through the auction lanes – including a national LeasePlan and SG Fleet dealer-only auction of 150 late-model cars – reflecting record sales over in the new market and subsequent high turnover.
Fleet and Lease vehicle sales are now up 44% YTD, Dealer vehicles are up 50%, OEM vehicles sold at closed dealer-only auctions are up 75%, and Government vehicles are up 59%.
About Cox Automotive Australia
Cox Automotive Australia is a subsidiary of Cox Automotive US, the world’s largest automotive services and technology provider.
Our local team of almost 600 people works with 26 automotive OEMs, as well as an array of automotive dealers and with the private and public fleet sector. Our parent company has 29,000 employees on five continents and a family of trusted brands that operate across the globe.
Cox Automotive is a subsidiary of Cox Enterprises Inc., a privately-owned, Atlanta-based company with $22 billion in annual revenue working in multiple industry sectors.
Our brands in Australia include Manheim Auctions (passenger, industrial and salvage), Kelley Blue Book, Sell My Car, and digital retailing solutions including LeadDriver and Xtime – an aftersales customer management platform used by several of Australia’s top OEMs in their dealer networks.
Manheim holds in-person and online wholesale vehicle auctions across Australia and New Zealand, with unique auction driving lanes in Melbourne, Brisbane and Sydney. Moreover, Manheim is a major salvage company for the insurance sector, and a major heavy industrial auctioneer.

For further information, please contact:
Mike Costello – Corporate Affairs Manager
M:+61 405 321 807 | E: mike.costello@coxautoinc.com
Read the latest full Market Insights Report Jan- Mar 2024 here
Definitions
Used Car Price Index
The Price Index tracks the movement of transaction prices relative to December 2019. It was created by taking the sold price of the used vehicles (from Dealers for the Retail Index or through Manheim auctions for the Wholesale Index), adjusted by the original Recommended Retail Price (RRP) when the vehicle was bought brand new, and volume weighted.
The base period is December 2019 with a value of 100 points. For example, an Index of 144.2 in May 2023 indicates that overall, the sold price has increased by 44.2% compared to December 2019.
Note that in calculating the index, the following vehicles are excluded:
- Brand new or heavy commercial vehicles;
- Vehicles that have travelled more than 60,000 km per year;
- Vehicles with more than 300,000 km;
- Vehicles less than two years old or more than 10 years old (for the Manheim Wholesale Used Car Price Index);
- Vehicles over 15 years old (for the Retail Dealer Used Car Price Index).
Active Listings
Level of dealer used and demo car stock in the reporting period. Active Listings represents a significant portion of used vehicle inventory advertised by Dealers nationally at the end of June 2023.
Sold Vehicles (Delisted)
Total Year-to-Date number of Dealers’ Used & Demo Vehicles delisted from advertisement in the reporting period which is assumed as sold.
Market Days Supply
Measuring the Supply & Demand dynamic by dividing the total number of Used Active Listings by the total number of vehicles sold within the last 45 days. 70 days MDS is the industry benchmark. MDS higher than 70 indicates over supply and vice versa.
Days to Sell
Dealers’ Demo & Used – Average Days to Sell measures the duration (in days) between when a vehicle was first advertised to when it was sold.