
Dealer used car prices down to 2021 levels despite strong consumer demand
- The Cox Automotive Price Index has declined for 17 of the past 18 months
- Older cars have more inflated prices relative to pre-COVID amid household spending pressures
- Used EV sales up 65% YoY and 120% over the past 24 months.
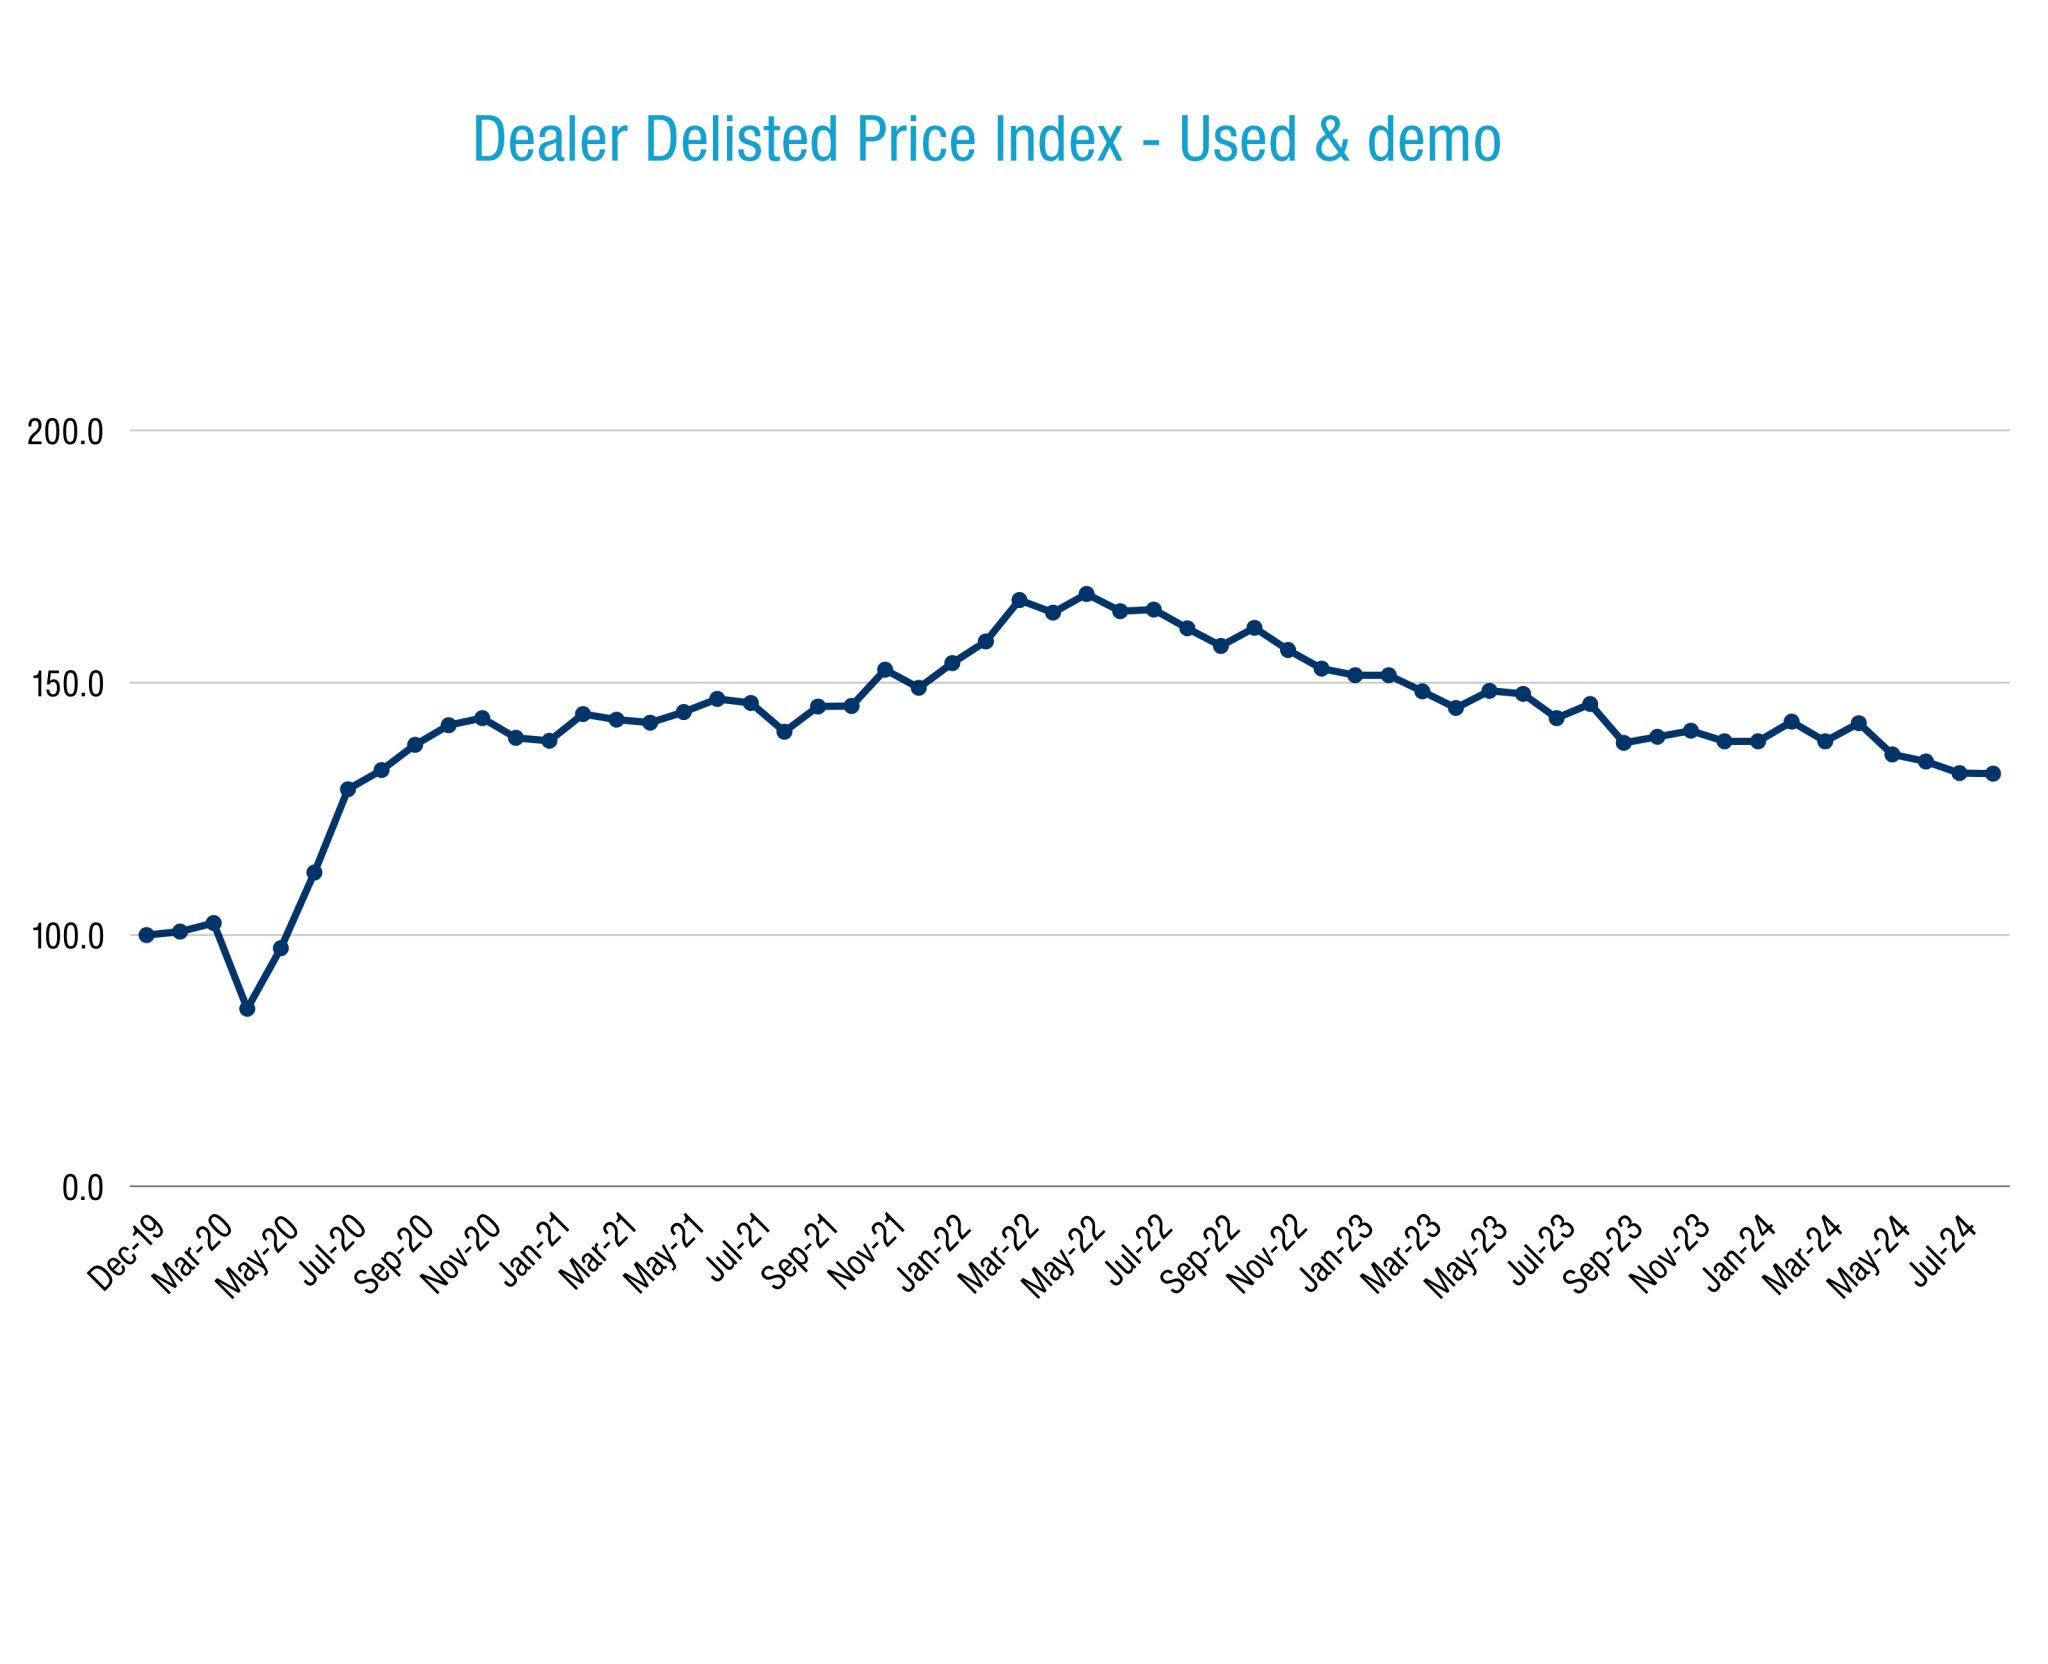
Dealer used vehicle selling prices cooled for the sixth consecutive month during August 2024, as measured on the Cox Automotive Australia (CAA) Price Index. The Price Index, which started at 100 points in December 2019, now sits at 130.7 — down 7.4% over the same point in 2023 and 11.7% across the past two years.
CAA collects retail data on a majority of dealer-listed used cars in Australia, in large part through its digital inventory management platform, SmartPublisher.
Dealer used vehicle supply for August 2024
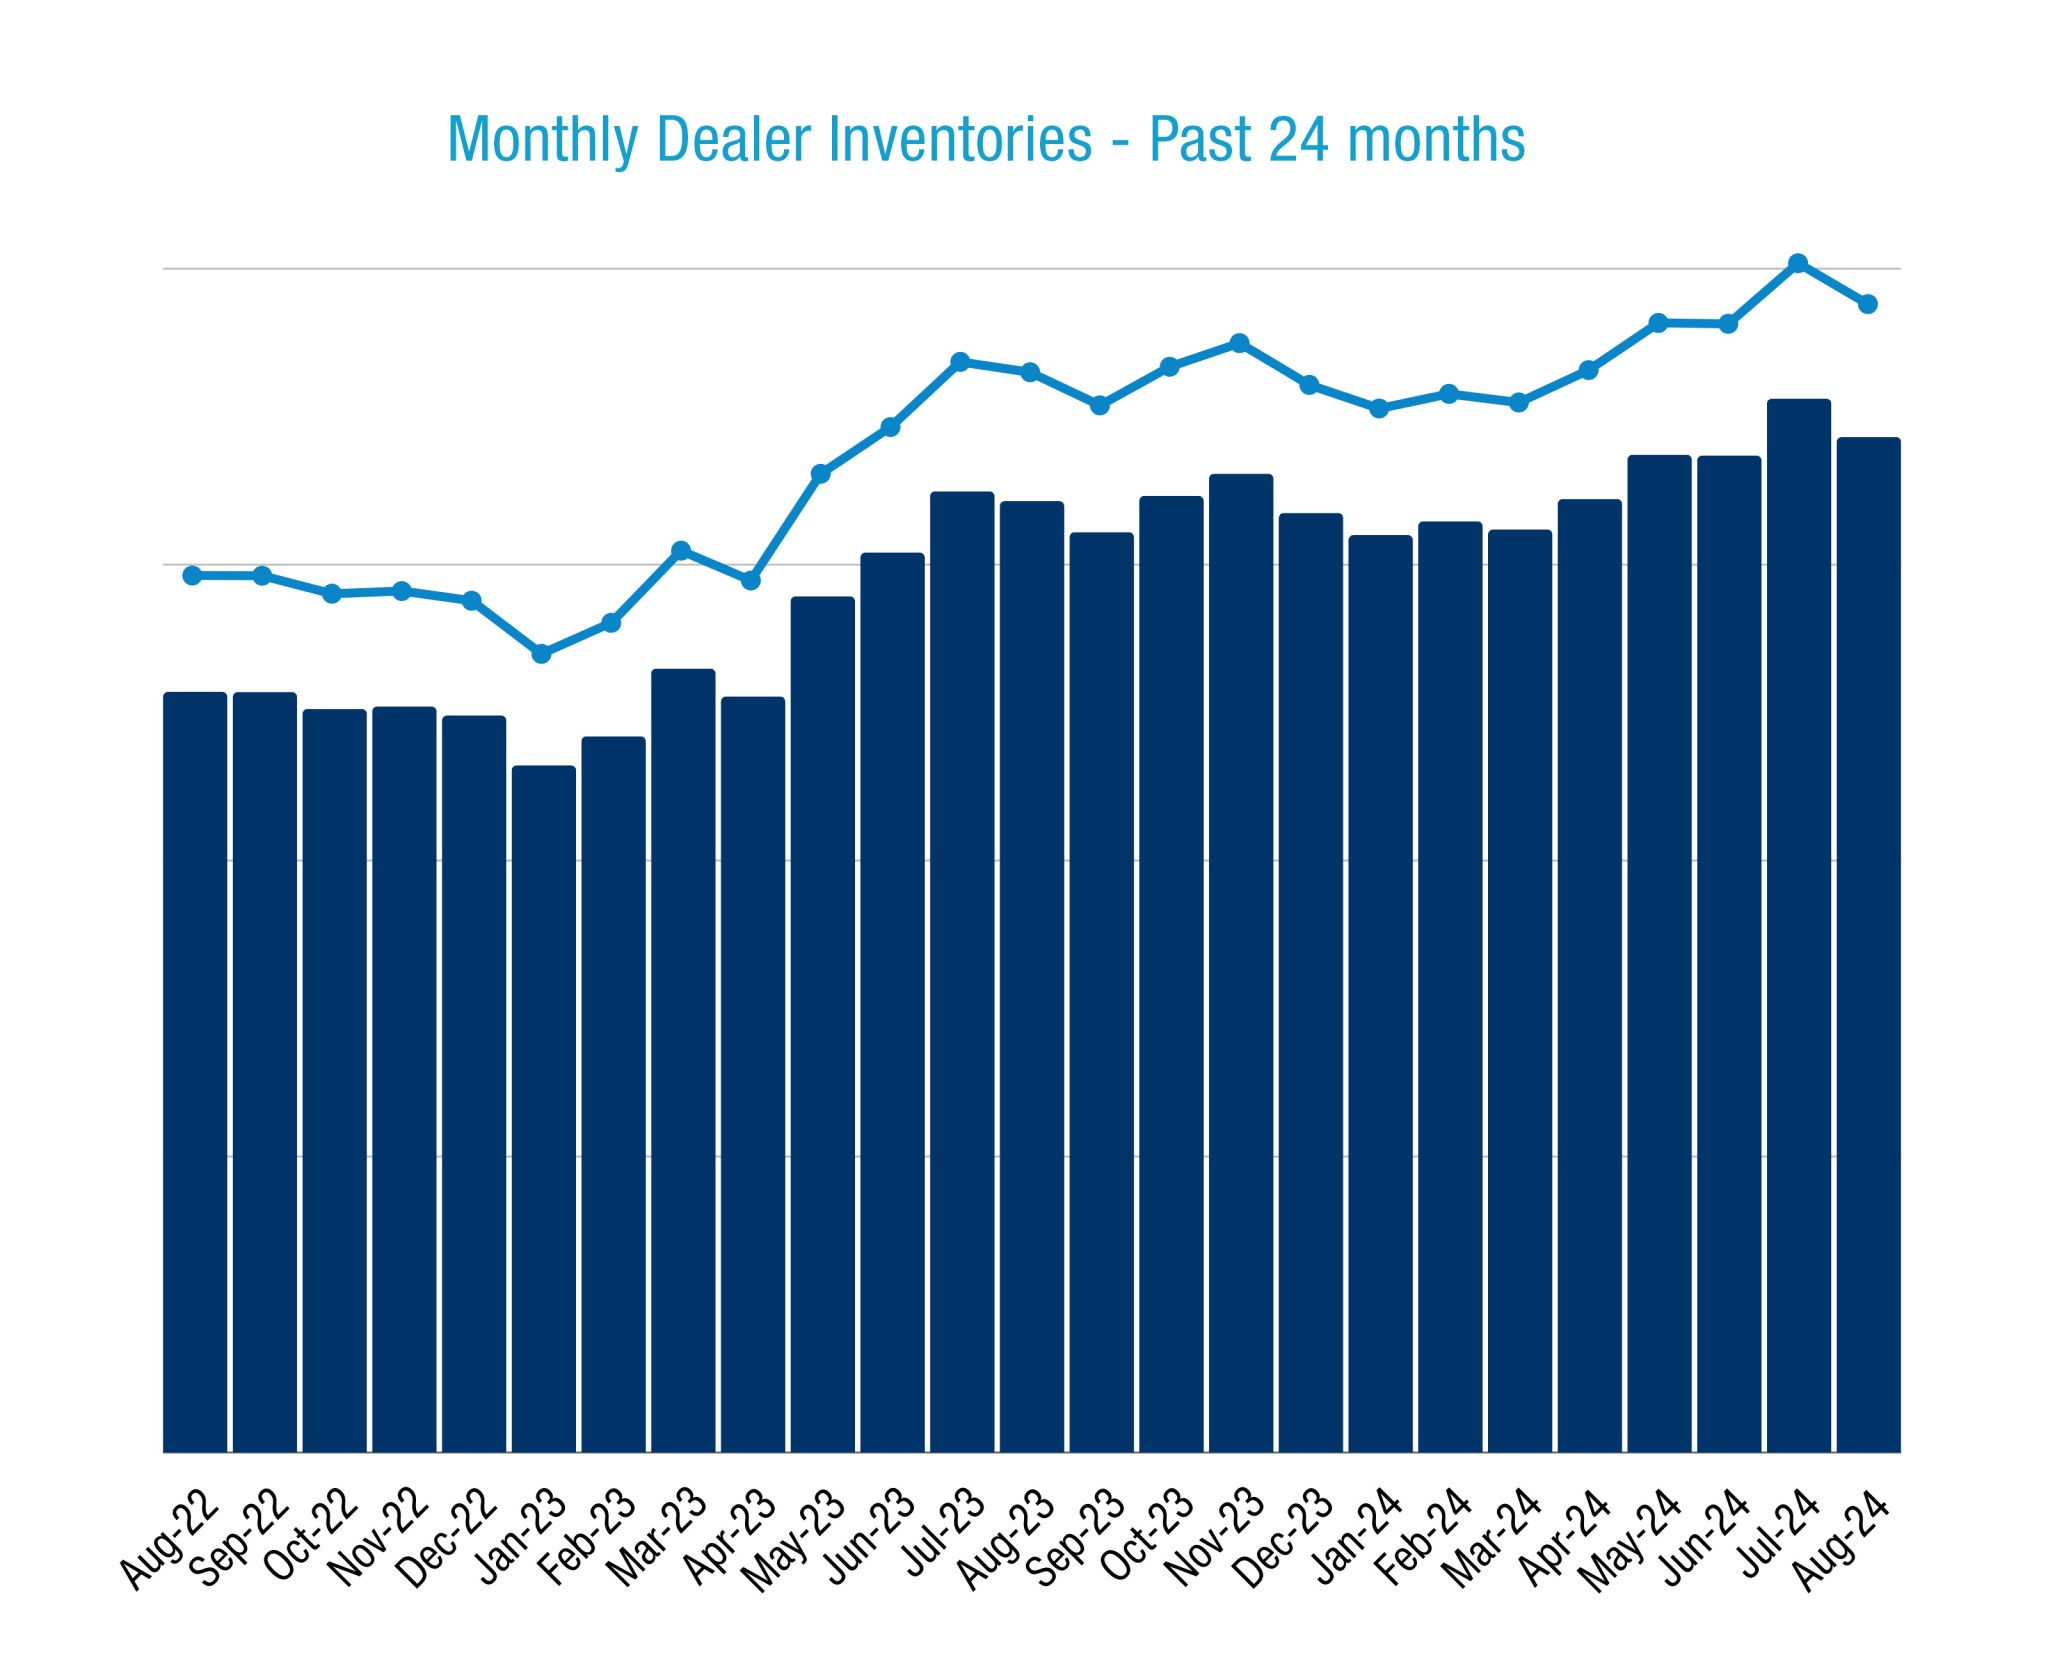
Dealer inventory in the CAA database declined 1.8% over July but remains 6.1% greater than this time in 2023 (YoY).
The number of listed used vehicles is up more than 30% in the past 24 months. Greater availability of used vehicles is a key theme right now, stemming in part from the all-time sales records we are seeing in the new market, driven by backorders and improved factory supply.
The most-stocked vehicles in dealers are the Ford Ranger (down 5.8% MoM), Toyota Corolla (down 2.9%), Toyota HiLux (down 5.5%), Toyota RAV4 (up 3.9%), and Mitsubishi Triton (down 5.3%).
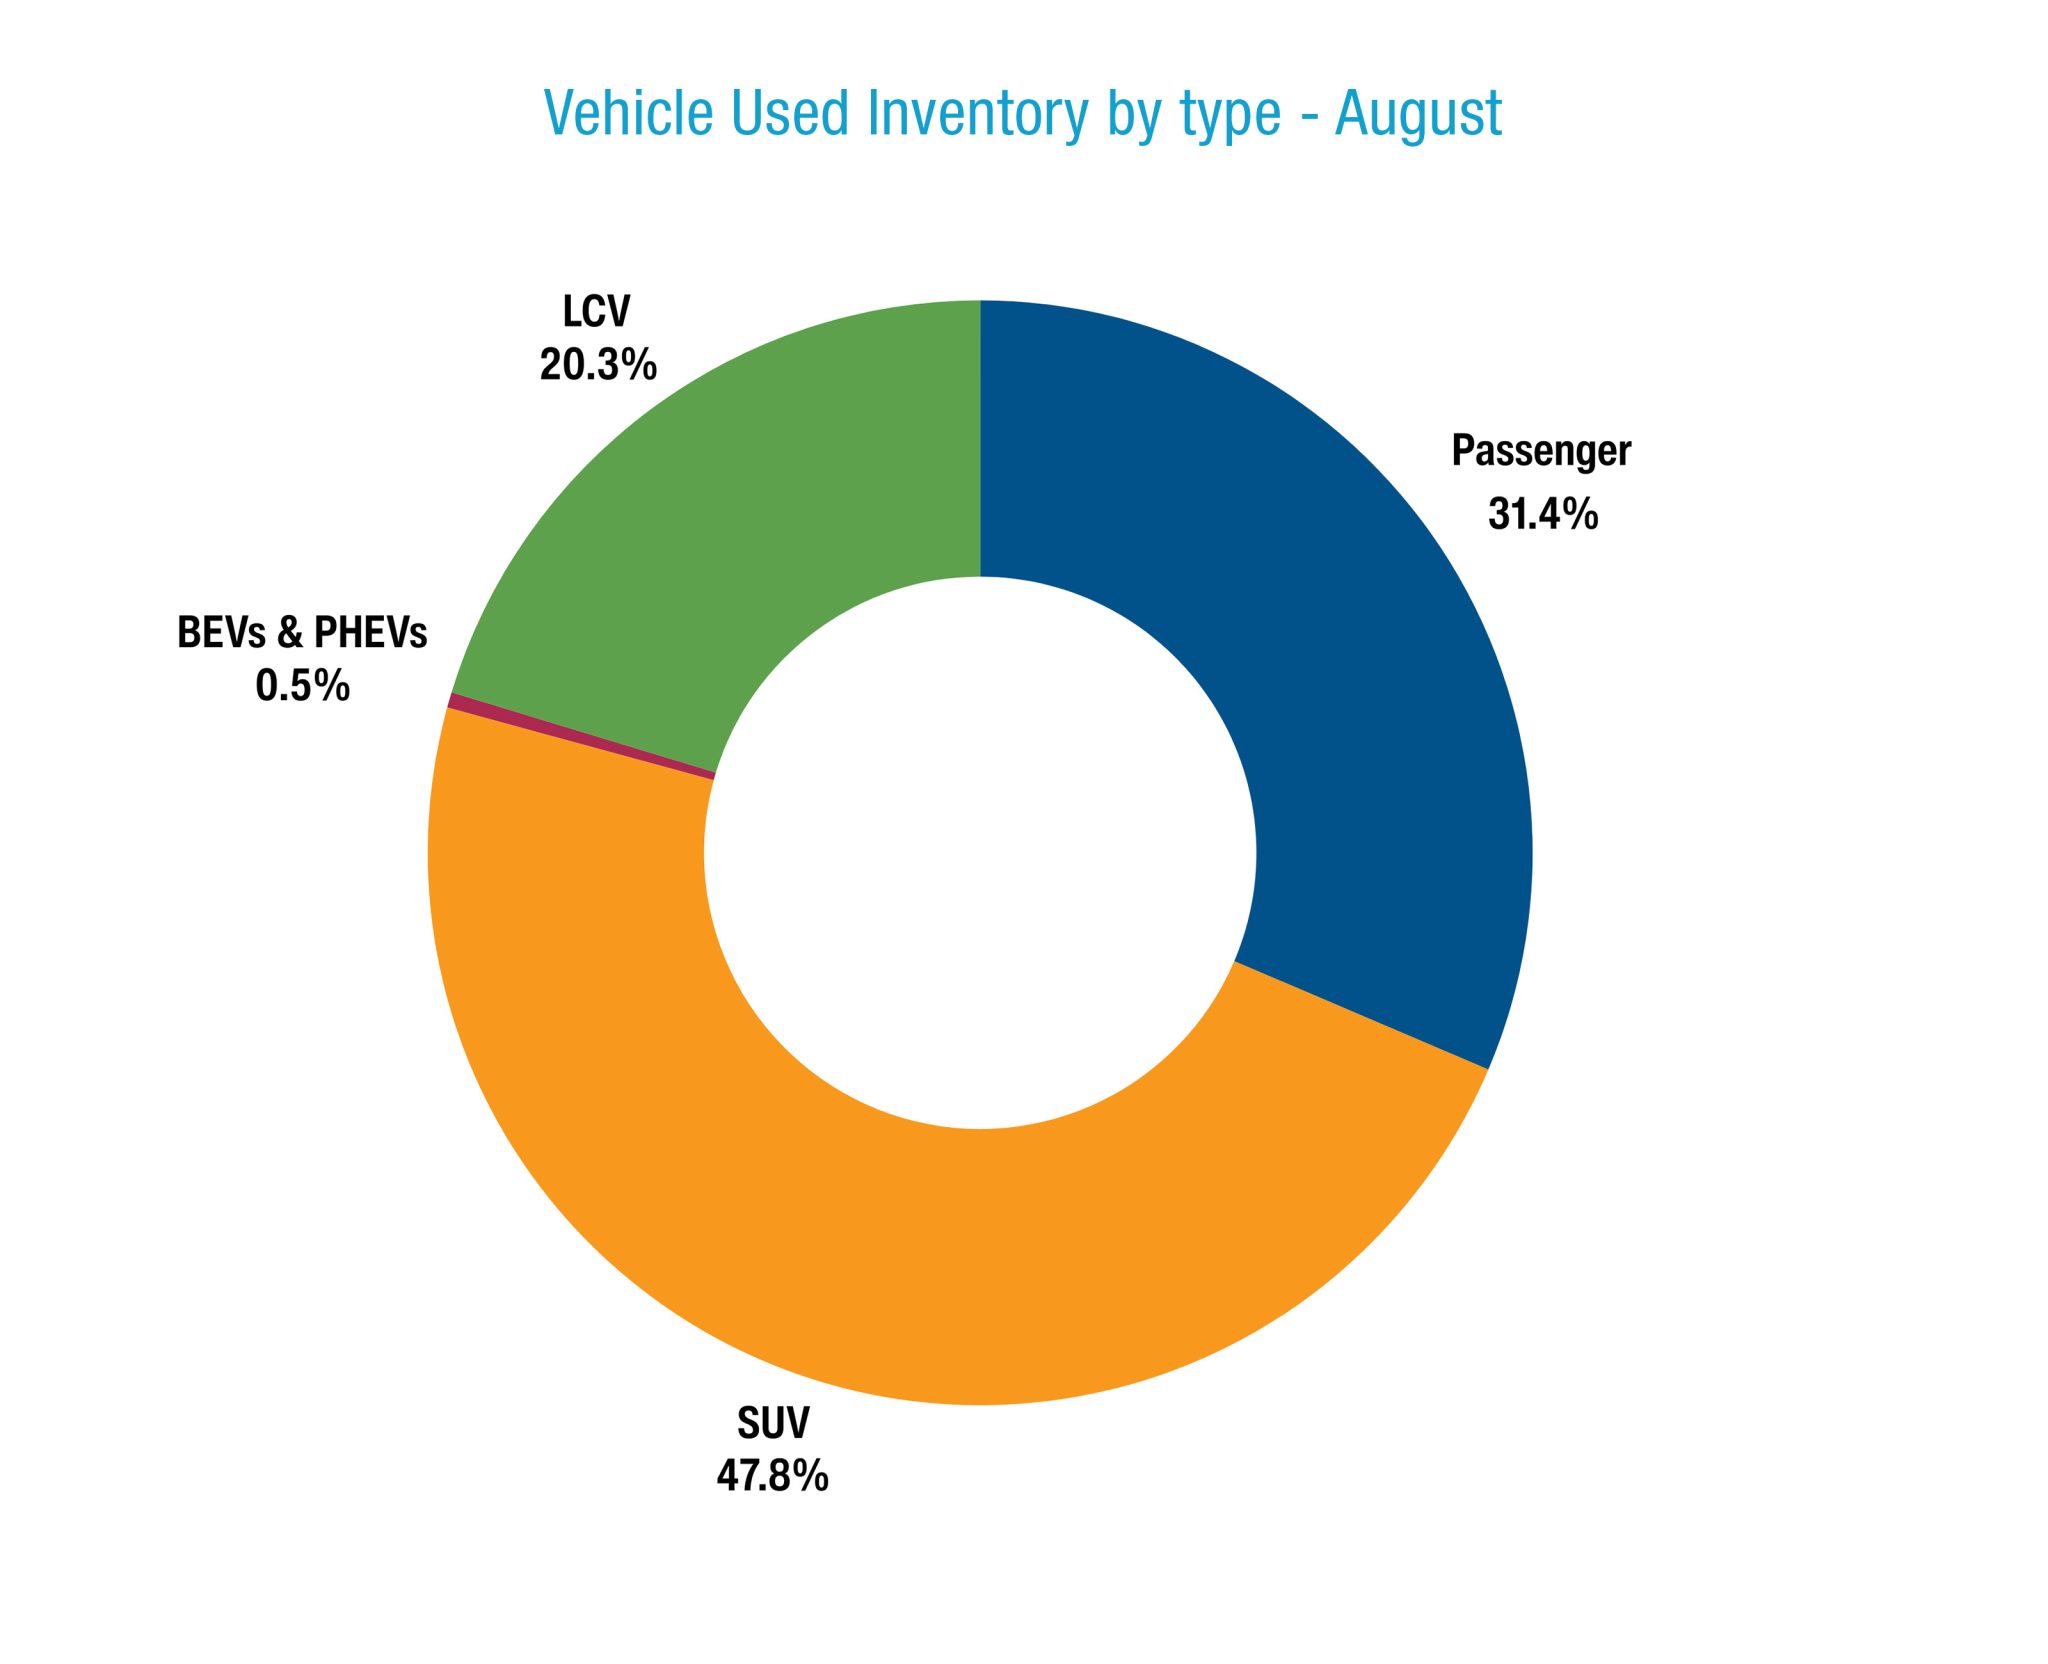
Because trends in the new market eventually impact the used market, dealer used inventories have increasingly fewer traditional passenger cars (hatchbacks, sedans etc) and more SUVs.
As of August 2024, passenger vehicles had a 29.6% share of used inventory, down from 31.9% share 12 months ago and 39% at the start of 2020. SUVs have trended in the other direction, with a 49% market share of inventory in August 2024, up from 48.5% 12 months ago, and 40.7% at the beginning of 2020.
While still a small percentage of overall stock, supply of second-hand EVs and PHEVs is up 64.8% year-on-year and 119.4% over the past two years.
Dealer used vehicle prices for August 2024
The CAA Price Index is now back to February 2021 levels and has been in decline for 17 of the previous 18 months. The average dealer discount was 7.1% per vehicle in August, with 41.7% of all delisted cars receiving one or more price change online.
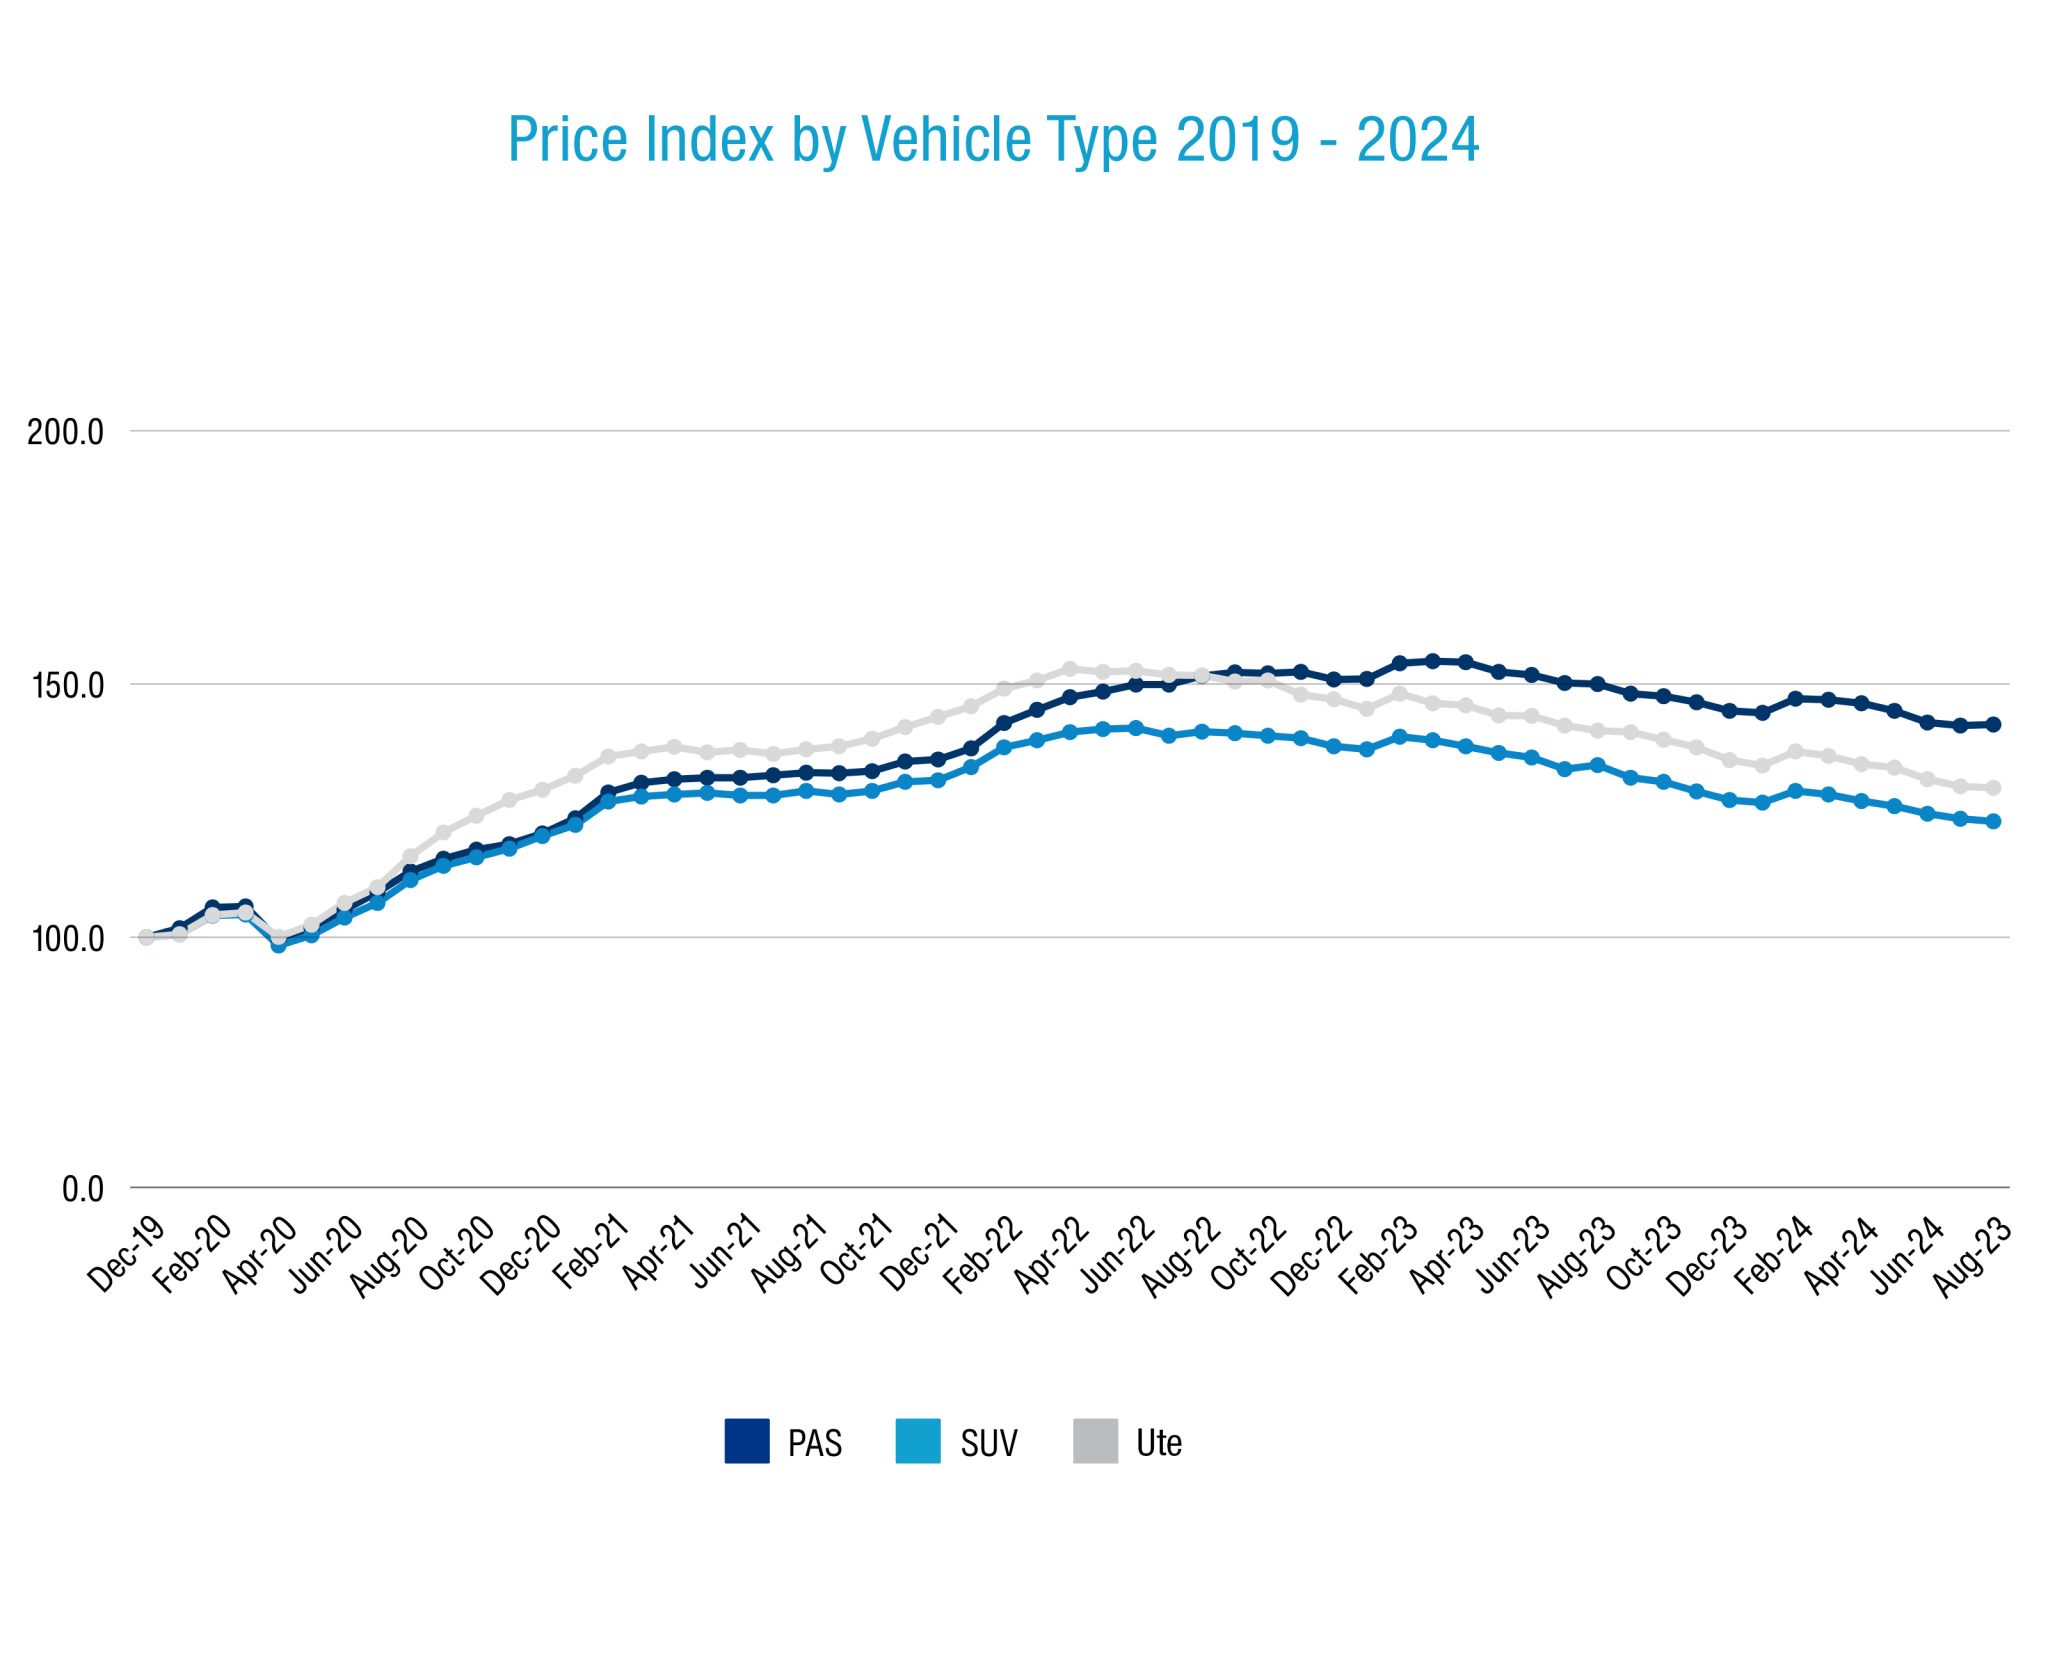
There are two overarching patterns emerging in terms of used car pricing: Traditional passenger cars are holding more inflated prices relative to pre-COVID levels than SUVs and light commercials are, likewise older vehicles are hanging onto higher relative selling prices than younger models are.
Two factors are likely behind this: First there’s a great deal of market demand for older and cheaper vehicles due to current household cost-of-living pressures, and second there’s a lot of supply of new vehicles now which naturally compresses what a dealer can charge for a late-model used car.
To this end, the current Price Index for passenger cars such as hatchbacks and sedans is 142, versus 122.9 for SUVs and 129.5 for utes. Staying with passenger cars, the Index for those aged 2-4 years is 131.2 whereas for those aged 8-10 years the Index is a more inflated 164.5.

Manheim in August and YTD
Manheim wholesale auction volume – excluding salvage and industrial – grew more than 30% in August YoY and is running 42% higher compared to the same January to August period in 2023 (YTD). August was the second-largest month of sales this year after July, with volumes running at four-year highs.
In addition to the strong fleet lease sales growth (up 47% YoY), Manheim is also observing strong volume upticks in vehicles being sold on behalf of OEMs (up 71% including dealer-only and public auctions), dealers (up 48%), government departments such as QFleet (up 47%), and rentals (up 56%).

The volume increases YoY are consistent across Australia, with the greatest incremental volume coming through Melbourne (up 46%) and Brisbane (up 51%). Manheim is also seeing strong percentage growth in Adelaide (43%), Darwin (86%), Hobart (20%), Newcastle (30%), Perth (43%), and Sydney (20%).
Average wholesale prices are down on average 7.6% this year and around 20% since the middle of 2022, when vehicle shortages were driving up transaction prices.
About Cox Automotive Australia
Cox Automotive Australia is a subsidiary of Cox Automotive US, the world’s largest automotive services and technology provider.
Our local team of almost 600 people works with 26 automotive OEMs, as well as an array of automotive dealers and with the private and public fleet sector. Our parent company has 29,000 employees on five continents and a family of trusted brands that operate across the globe.
Cox Automotive is a subsidiary of Cox Enterprises Inc., a privately-owned, Atlanta-based company with $22 billion in annual revenue working in multiple industry sectors.
Our brands in Australia include Manheim Auctions (passenger, industrial and salvage), Kelley Blue Book, Sell My Car, and digital retailing solutions including LeadDriver and Xtime – an aftersales customer management platform used by several of Australia’s top OEMs in their dealer networks.
Manheim holds in-person and online wholesale vehicle auctions across Australia and New Zealand, with unique auction driving lanes in Melbourne, Brisbane and Sydney. Moreover, Manheim is a major salvage company for the insurance sector, and a major heavy industrial auctioneer.

For further information, please contact:
Mike Costello – Corporate Affairs Manager
M:+61 405 321 807 | E: mike.costello@coxautoinc.com
Read the latest full Market Insights Report Jan- Mar 2024 here
Definitions
Used Car Price Index
The Price Index tracks the movement of transaction prices relative to December 2019. It was created by taking the sold price of the used vehicles (from Dealers for the Retail Index or through Manheim auctions for the Wholesale Index), adjusted by the original Recommended Retail Price (RRP) when the vehicle was bought brand new, and volume weighted.
The base period is December 2019 with a value of 100 points. For example, an Index of 144.2 in May 2023 indicates that overall, the sold price has increased by 44.2% compared to December 2019.
Note that in calculating the index, the following vehicles are excluded:
- Brand new or heavy commercial vehicles;
- Vehicles that have travelled more than 60,000 km per year;
- Vehicles with more than 300,000 km;
- Vehicles less than two years old or more than 10 years old (for the Manheim Wholesale Used Car Price Index);
- Vehicles over 15 years old (for the Retail Dealer Used Car Price Index).
Active Listings
Level of dealer used and demo car stock in the reporting period. Active Listings represents a significant portion of used vehicle inventory advertised by Dealers nationally at the end of June 2023.
Sold Vehicles (Delisted)
Total Year-to-Date number of Dealers’ Used & Demo Vehicles delisted from advertisement in the reporting period which is assumed as sold.
Market Days Supply
Measuring the Supply & Demand dynamic by dividing the total number of Used Active Listings by the total number of vehicles sold within the last 45 days. 70 days MDS is the industry benchmark. MDS higher than 70 indicates over supply and vice versa.
Days to Sell
Dealers’ Demo & Used – Average Days to Sell measures the duration (in days) between when a vehicle was first advertised to when it was sold.